Education voucher at hand? Step into the fast lane: Contact us
Contact us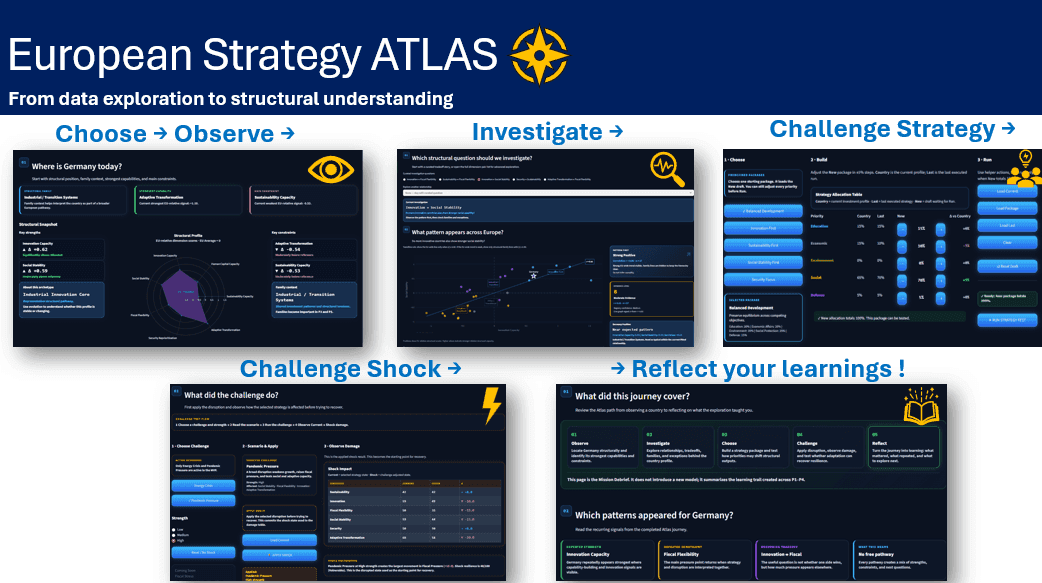
European Strategy Atlas
European countries are often compared through individual indicators, rankings, or dashboards. But these approaches can make it difficult to understand the broader picture: how different capabilities interact, what tradeoffs countries face, and how similar outcomes can emerge through very different development pathways.
The European Strategy Atlas was developed to explore this complexity in a more structured and interactive way. Using public Eurostat data for all 27 EU member states, the project combines indicators covering areas such as innovation, human capital, sustainability, social stability, fiscal flexibility, and security into an interpretable analytical framework. Countries are compared not only by individual measures, but also through structural dimensions, recurring country families, tradeoffs, and changes over time.
The analysis is translated into an interactive Streamlit application designed as a guided learning journey rather than a conventional dashboard. Users can explore a country's structural profile, compare it with other countries, investigate relationships between development dimensions, experiment with alternative strategic priorities, test those choices against hypothetical challenges, and reflect on what they discovered.
The Atlas does not attempt to predict the future, identify an optimal strategy, or recommend policies. Instead, it uses transparent analytical methods and interactive exploration to help users investigate evidence, ask questions, and understand complex systems from multiple perspectives.
The project combines Python-based data analysis, normalization, hierarchical clustering, correlation and tradeoff analysis, interactive visualization with Plotly, and application development with Streamlit.
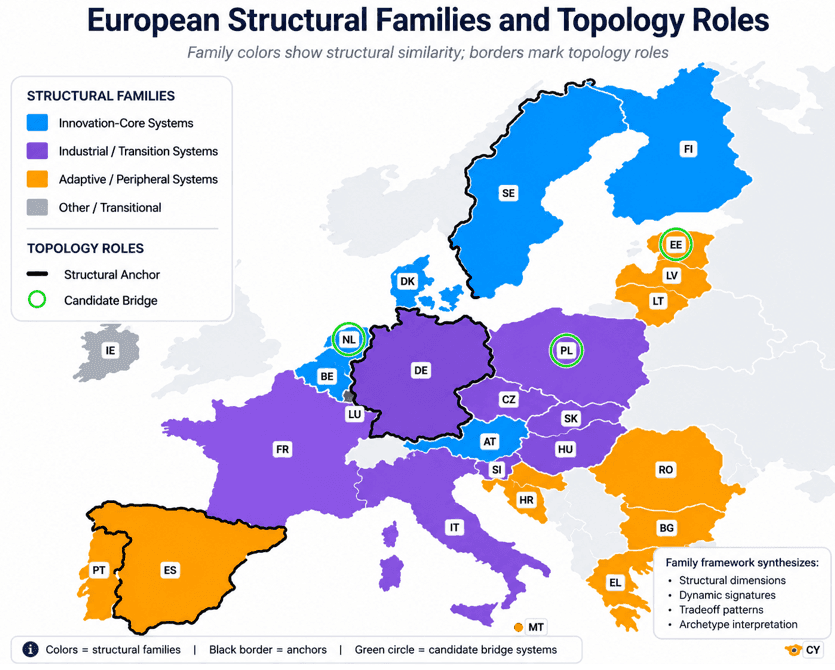
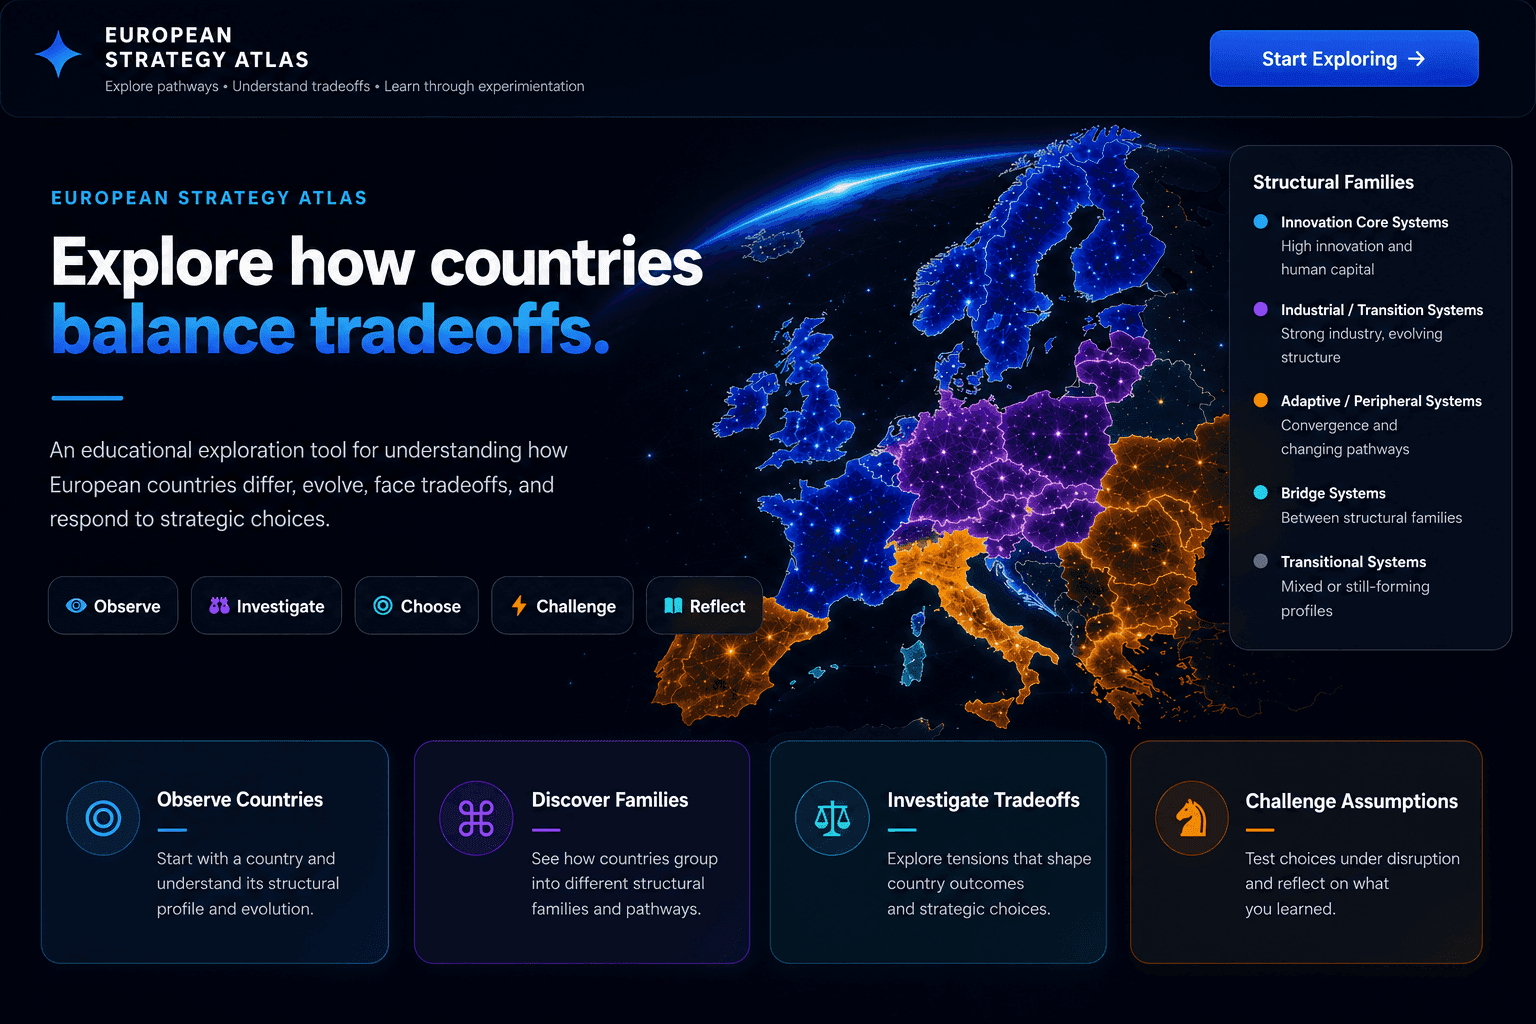
The goal of the European Strategy Atlas is to make complex European public data easier to explore and understand without reducing countries to a single ranking or score. The project develops a transparent analytical framework that connects individual indicators to broader structural dimensions, country families, tradeoffs, and development pathways. Through guided interaction, users can investigate how countries differ, how structural relationships depend on context, and how different priorities may shape alternative strategies. The objective is not to forecast or recommend policies, but to create an accessible learning environment that encourages evidence-informed exploration, critical thinking, and a systems perspective on complex public data.
The Team
- Gilad Gotesman
Gilad Gotesman is a scientist, systems thinker, and data analyst with a Ph.D. in Chemical Physics and more than 15 years of experience in industrial R&D and technology development. After relocating to Berlin, he expanded his analytical toolkit through the Data Analytics & AI bootcamp at SPICED, combining Python, SQL, visualization, and AI-assisted workflows with his experience in structured investigation, complex systems, and decision support
SocialsLinkedIn
We AI-proof
your career


